
The Reports workspace runs UnitConnect's financial and operational reports on screen, straight from your live data, and exports them to PDF or Excel.
Open a report
- In the sidebar, click Reports.
- The landing page shows Your saved views, any Scheduled reports, and the Available reports. Click a report to open it, or pick one from the list on the left. Reports are grouped into sets such as Rent Payment Reports and Income Reports; type in Search report or set… to find one.
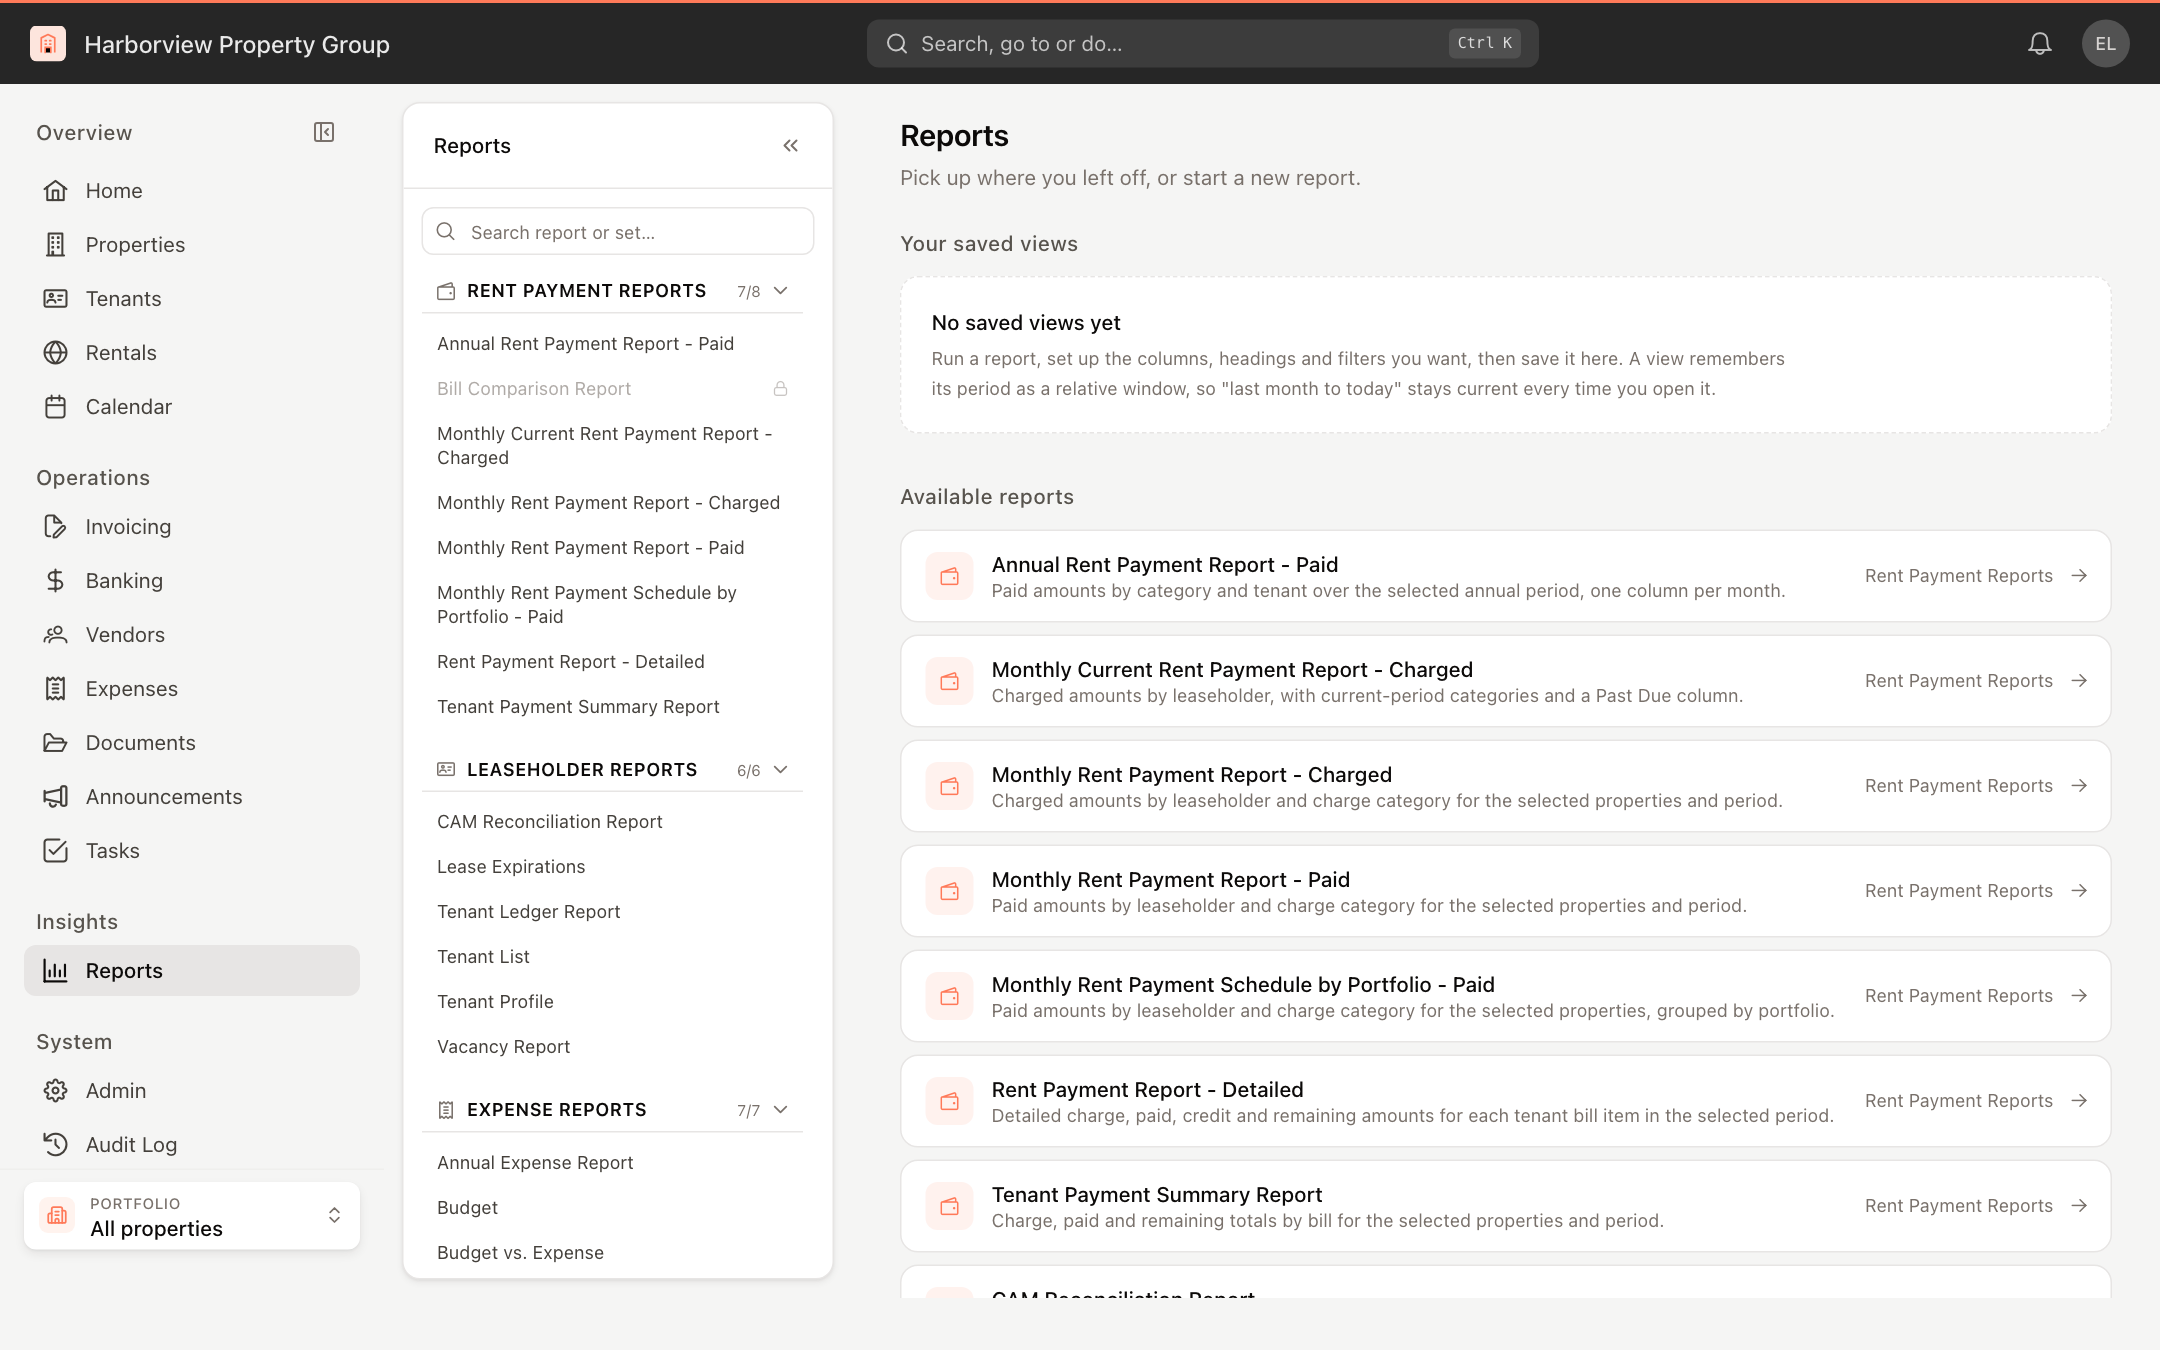
A report shown dimmed with a lock icon has not moved to the new reporting engine yet and still runs in the previous version of UnitConnect. For a list of the reports you can run here, see Report catalog.
Choose filters and run
Each report shows only the filters it uses. Common ones are:
- Properties — click the property picker and tick one or more properties. Reports that support portfolios also let you pick a whole portfolio.
- The date filter — a preset such as last month to today, or a custom range.
- Report options such as Accrual / Cash.
- More filters — some reports add a filter button with Tenants, Bank accounts or Vendors.
Then click Run report.
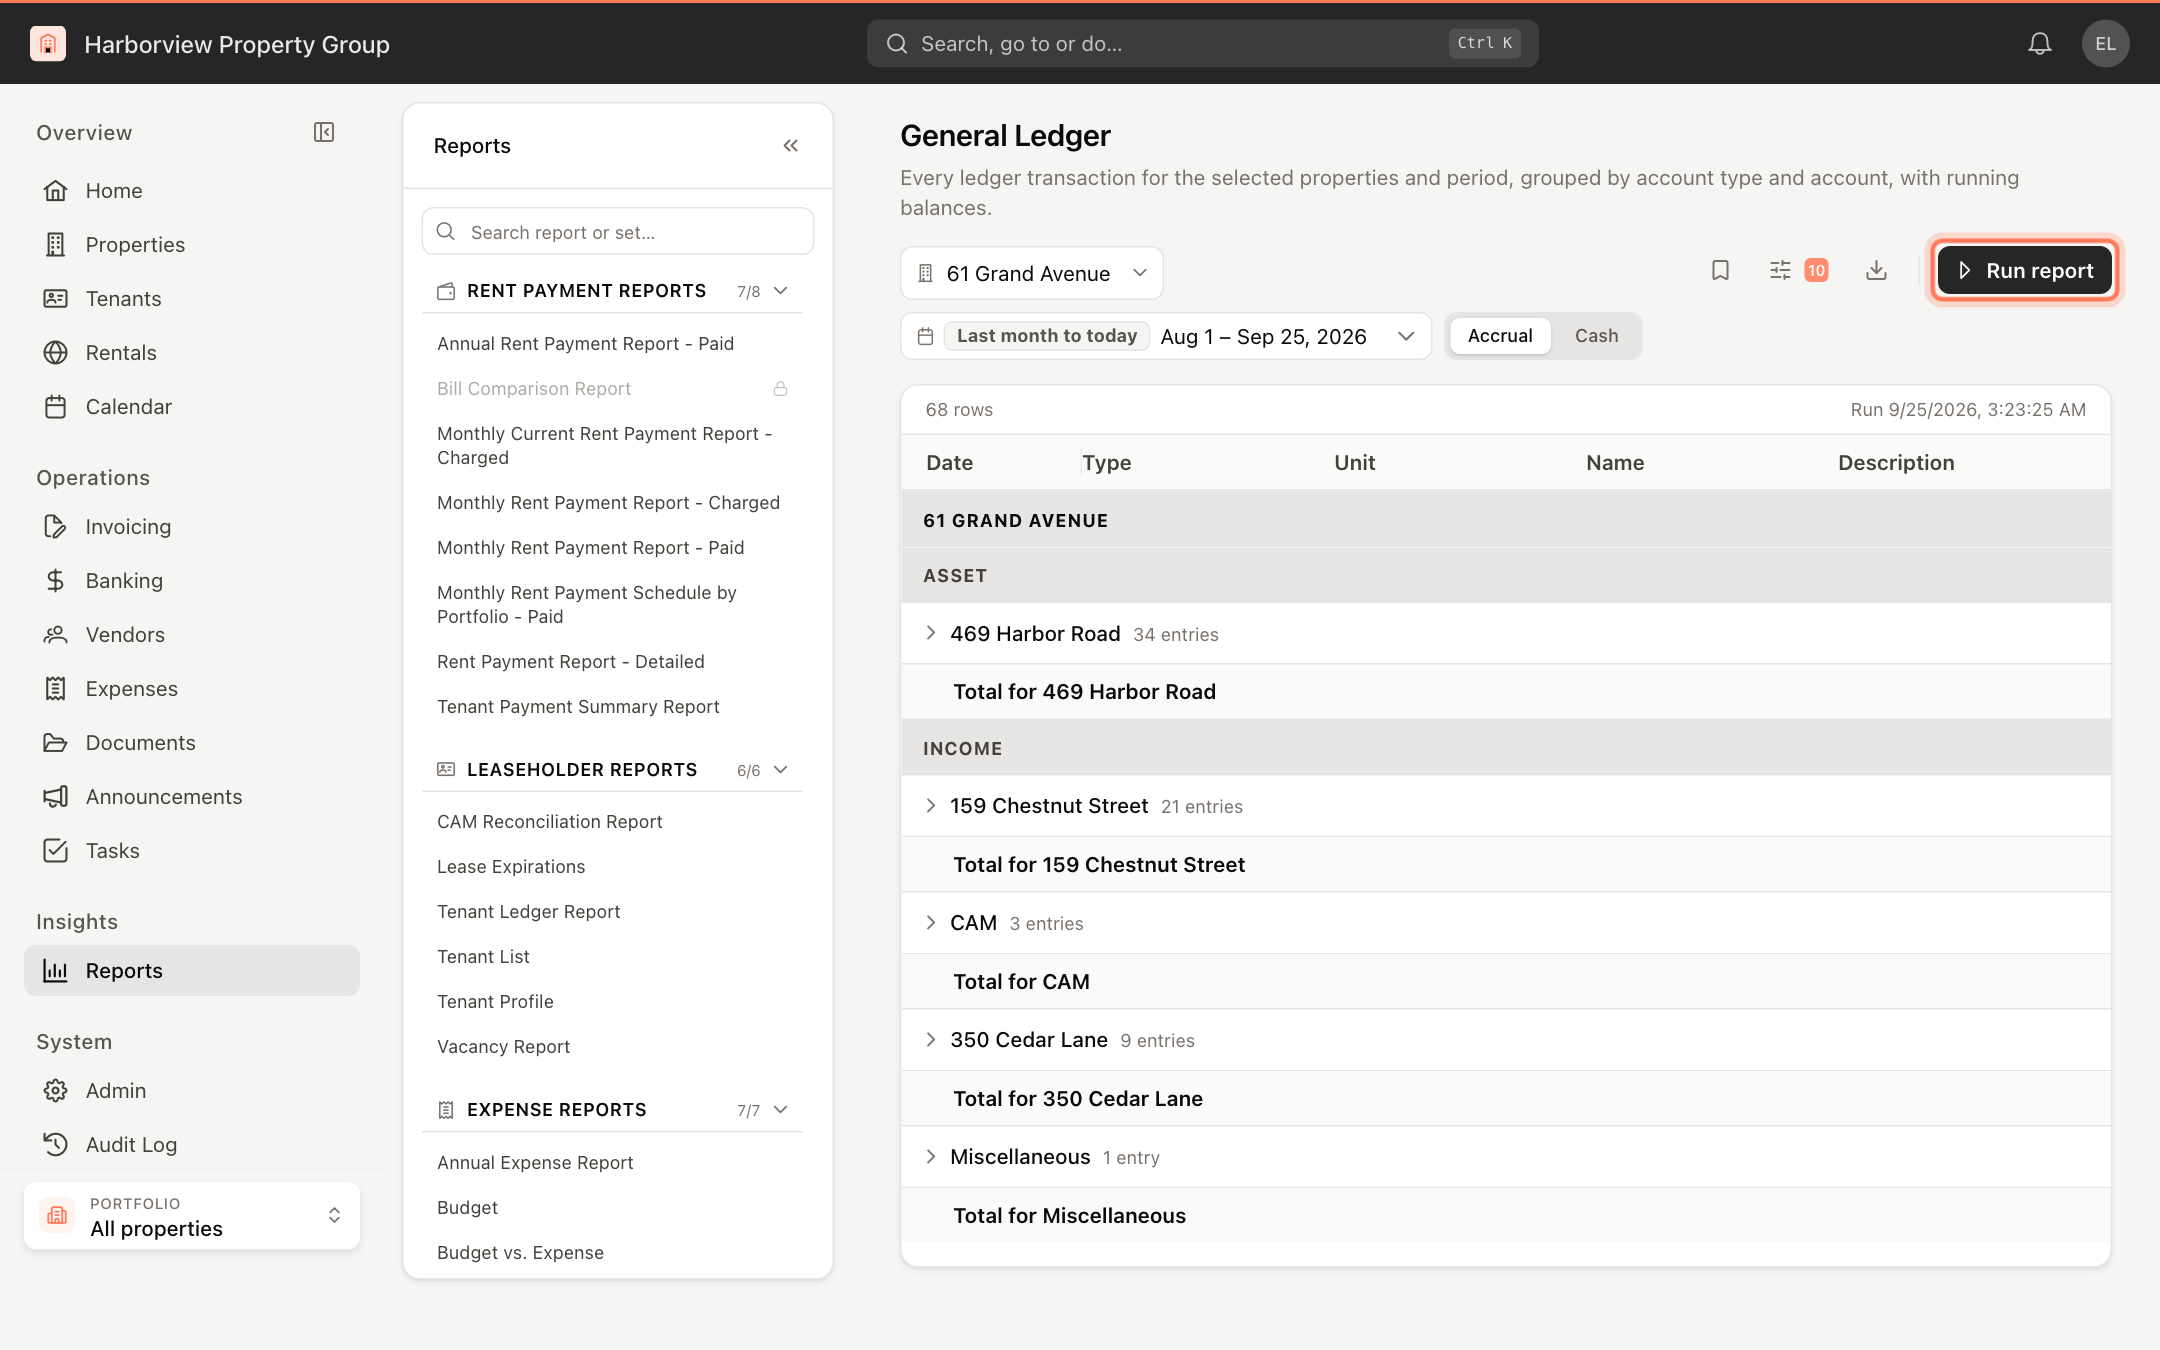
The results show the number of rows and when the report ran. Grouped reports open with their groups collapsed; click a group to expand it. Click a column heading to sort by it. Where a row refers to a tenant, invoice, bill or other record, click it to open that record; a return link brings you back to the report.
A running-balance column can't stay correct when rows are re-sorted, so it is hidden while you sort. Click Clear sort in the notice to bring it back.
Choose and rename columns
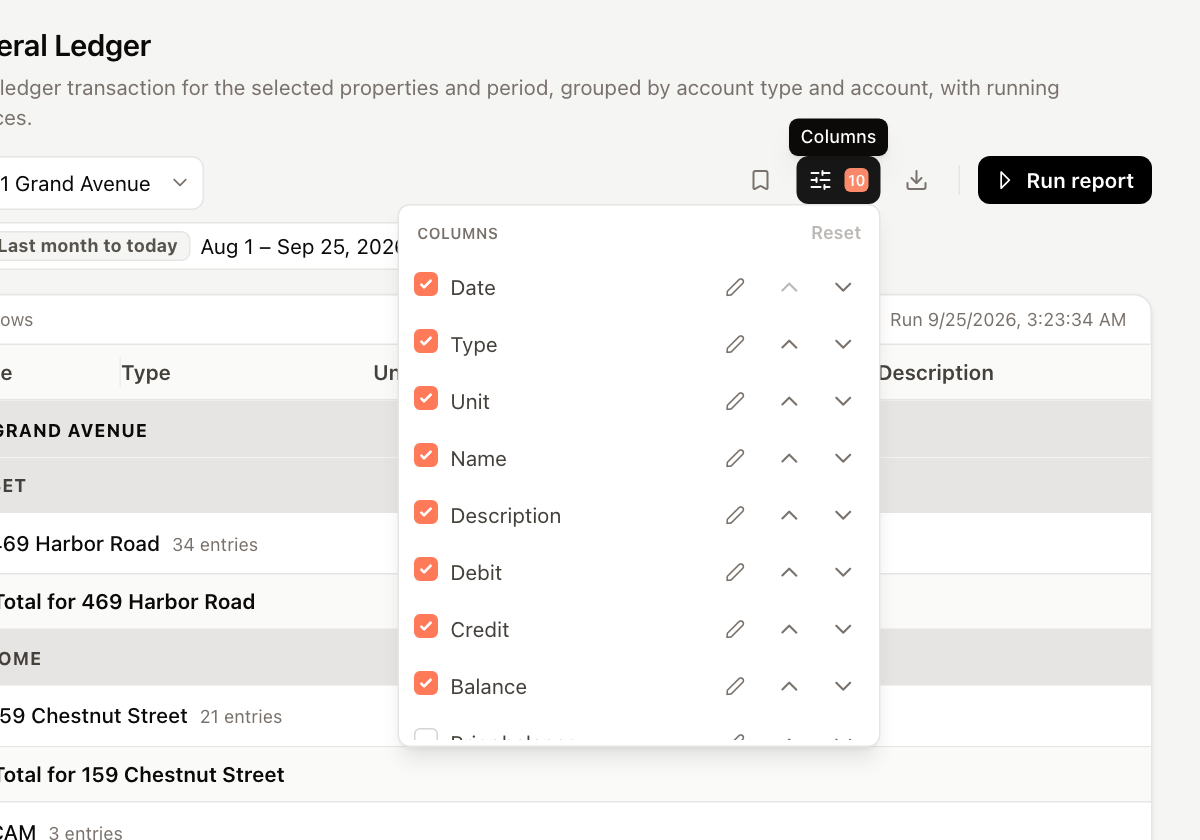
Click Columns (the sliders icon) after running the report:
- Tick or untick columns to show or hide them. The badge on the icon counts the visible columns.
- Click the pencil to rename a column heading.
- Use the arrows to move a column up or down.
- Click Reset to go back to the report's default columns.
Export to PDF or Excel
- Run the report.
- Click Export (the download icon).
- Choose PDF (paginated, with repeating headings) or Excel (live numbers and dates, with bands and subtotals kept).
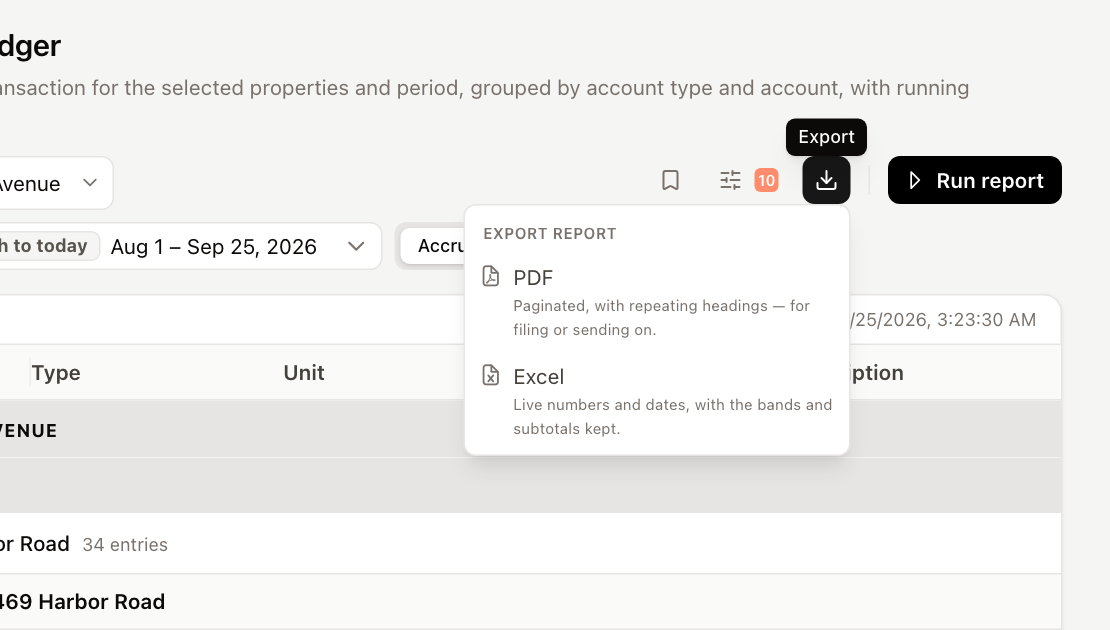
The export uses the columns and headings you see on screen.
The Reports page requires permission to view reports. Each report only includes the properties you have access to.